The Arctic cryosphere is collapsing, posing overlapping environmental risks. In particular, thawing permafrost threatens to release biological, chemical and radioactive materials that have been sequestered for tens to hundreds of thousands of years.
As these constituents re-enter the environment, they have the potential to disrupt ecosystem function, reduce the populations of unique Arctic wildlife and endanger human health.
Here, we review the current state of the science to identify potential hazards currently frozen in Arctic permafrost.
We also consider the cascading natural and anthropogenic processes that may compound the impacts of these risks, as it is unclear whether the highly adapted Arctic ecosystems have the resilience to withstand new stresses.
We conclude by recommending research priorities to address these underappreciated risks.
--------------------------------------------------
Sensitivity of the carbon cycle in the Arctic to climate change
The recent warming in the Arctic is affecting a broad spectrum of physical, ecological, and human/cultural systems that may be irreversible on century time scales and have the potential to cause rapid changes in the earth system. The response of the carbon cycle of the Arctic to changes in climate is a major issue of global concern, yet there has not been a comprehensive review of the status of the contemporary carbon cycle of the Arctic and its response to climate change. This review is designed to clarify key uncertainties and vulnerabilities in the response of the carbon cycle of the Arctic to ongoing climatic change. While it is clear that there are substantial stocks of carbon in the Arctic, there are also significant uncertainties associated with the magnitude of organic matter stocks contained in permafrost and the storage of methane hydrates beneath both subterranean and submerged permafrost of the Arctic. In the context of the global carbon cycle, this review demonstrates that the Arctic plays an important role in the global dynamics of both CO2 and CH4. Studies suggest that the Arctic has been a sink for atmospheric CO2 of between 0 and 0.8 Pg C/yr in recent decades, which is between 0% and 25% of the global net land/ocean flux during the 1990s. The Arctic is a substantial source of CH4 to the atmosphere (between 32 and 112 Tg CH4/yr), primarily because of the large area of wetlands throughout the region. Analyses to date indicate that the sensitivity of the carbon cycle of the Arctic during the remainder of the 21st century is highly uncertain. To improve the capability to assess the sensitivity of the carbon cycle of the Arctic to projected climate change, we recommend that (1) integrated regional studies be conducted to link observations of carbon dynamics to the processes that are likely to influence those dynamics, and (2) the understanding gained from these integrated studies be incorporated into both uncoupled and fully coupled carbon–climate modeling efforts.
Introduction
Global surface air temperature has increased substantially since the middle of the 19th century (Jones and Mogberg 2003), with a warming trend that has been very strong since about 1980 (Alley et al. 2003, Johannessen et al. 2004). Recent studies have revealed surface air temperature increases on the average of 0.6°C per decade since 1985 over land and ocean areas north of 62° N (Polyakov et al. 2002) and 0.35°C per decade from 1970 to 2000 for terrestrial regions between 50° and 70° N (Serreze and Francis 2006, Euskirchen et al. 2007). The recent warming in high latitudes is affecting a broad spectrum of physical, ecological, and human/cultural systems in this region (Serreze et al. 2000, Chapin et al. 2005a, b, Hinzman et al. 2005, Serreze and Francis 2006). Some of these changes may be irreversible on century time scales, and have the potential to cause rapid changes in the earth system (Curry et al. 1996, Chapin et al. 2000, McGuire and Chapin 2006). Given the large stores of carbon (C) in northern high latitude regions, the response of the C cycle of the Arctic to changes in climate is a major issue of global concern (Arctic Climate Impact Assessment 2004, 2005, McGuire et al. 2006).
Various aspects of the C cycle of the Arctic have been discussed in individual chapters of the recently completed Arctic Climate Impact Assessment (2005), and a book has been devoted to the Arctic's marine organic C cycle (Stein and Macdonald 2004). However, there has not been a comprehensive scientific review of the status of the contemporary C cycle of the terrestrial–marine Arctic system and its response to climate change. Our overall goal in this review is to clarify key uncertainties and vulnerabilities in the response of the C cycle of northern high latitude regions to projected climate change. Our approach is to (1) first define what we mean by the “Arctic carbon cycle,” (2) provide a contemporary picture of the stocks and fluxes of the C cycle of the Arctic, (3) discuss the role of the Arctic in the contemporary global C cycle, and (4) discuss the current understanding of the sensitivities of the carbon cycle of the Arctic to climate change during the next 50–100 years and their implications for the global C cycle. We conclude by discussing key uncertainties in the response of the C cycle of the Arctic to climate change and provide thoughts on how those uncertainties might be reduced. Please see the Appendix for additional references provided for each section of this review.
The Arctic Carbon Cycle: Definition and Background
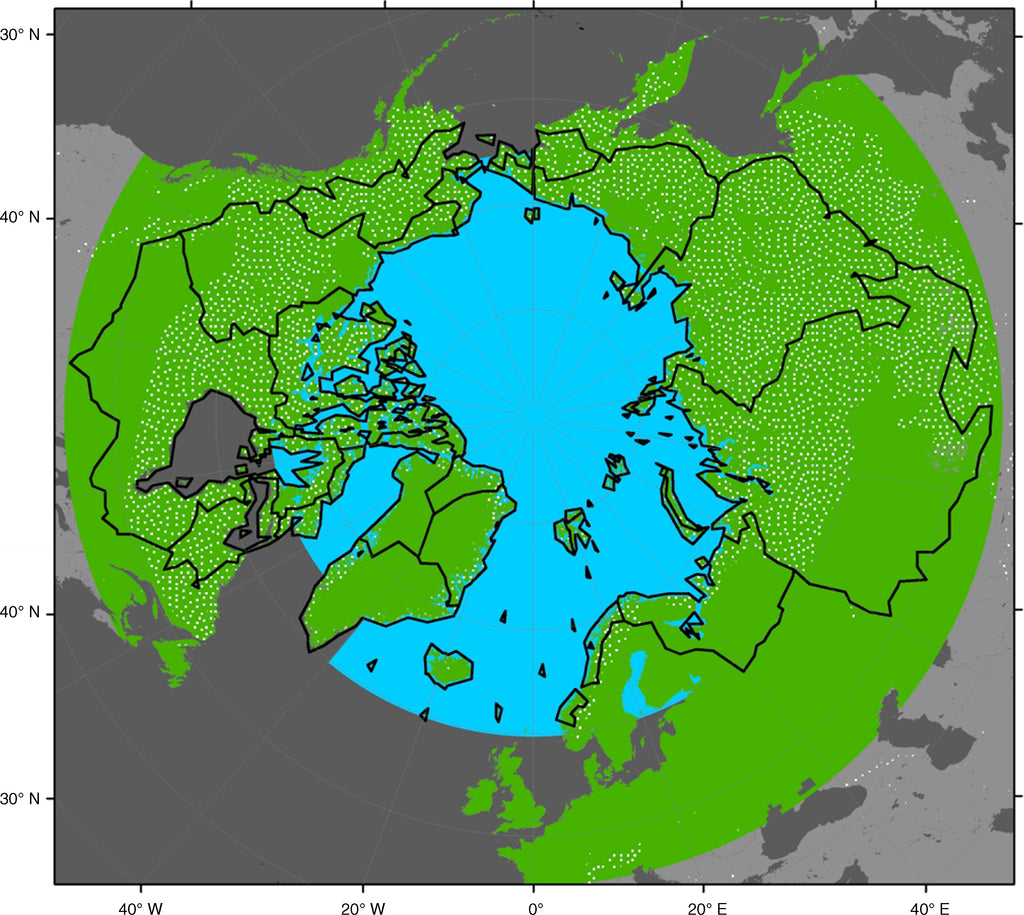
The spatial domain of the Arctic has been defined in many ways, each of which may be appropriate for a particular context. In this review, we expand on the astronomical (poleward from the Arctic Circle at 66°30′ N) and climatic (mean surface temperature of the warmest month below 10°C) definitions by merging the hydrologic and cryospheric definitions of the Arctic to generally consider it as the Arctic Ocean, as outlined in Stein and Macdonald (2004) and Macdonald et al. (2009), with the land areas that drain into the Arctic Ocean and its marginal seas and extend to the southern limit of discontinuous permafrost, excluding anomalies associated with elevation (e.g., the Tibetan Plateau). This definition of the Arctic covers the portion of the globe above approximately 45° N latitude, which comprises large expanses of the northern continents including much of the boreal forest zone in addition to the northern high-latitude polar and arctic regions (Fig. 1). It is important to recognize that, while this definition provides a general sense of what we conceptually consider to be the area contributing to the C cycle of the Arctic, it serves as a flexible guideline for synthesizing information from studies that have been conducted from various atmospheric, oceanic, and terrestrial perspectives of the Arctic.

Definitions of the “Arctic system” based on the large-scale circulation of the Arctic Ocean, hydrology, and land areas underlain by permafrost. This review includes the blue-shaded Ocean area that is north of Fram Strait and the Canadian Archipelago (i.e., we do not consider the Bering Sea, Hudson Bay, and the Nordic Seas in this study). The green area depicts the circumpolar land area north of 45° N, for which this review considers the pan-arctic terrestrial C cycle. This land area designation is inclusive of all pan-arctic watersheds that drain into the Arctic Ocean (heavy black outlines), as well as the distribution of land underlain by permafrost in the Northern Hemisphere over unglaciated regions (white stippled area) but excluding high-elevation anomalies farther south. The Arctic Ocean area designation is courtesy of Leif Anderson, the pan-arctic watershed boundaries are derived from Lammers et al. (2001), and the permafrost distribution is based on maps from the National Snow and Ice Data Center (Brown et al. 1998).
Our large-scale view of the carbon cycle of the Arctic (Fig. 2) considers (1) the stocks of C in the terrestrial and oceanic components of the Arctic, (2) the exchange of carbon dioxide (CO2) and methane (CH4) between these components and the atmosphere, (3) the transfer of C between land and ocean as CH4, dissolved organic carbon (DOC), dissolved inorganic carbon (DIC), particulate inorganic carbon (PIC), and particulate organic carbon (POC), and (4) the exchange of CH4, DOC, and DIC between the oceanic component of the Arctic and the adjacent Pacific and Atlantic Oceans. Throughout this assessment, we refer to 106 g as megagrams (Mg), 109 g as gigagrams (Gg), 1012 g as teragrams (Tg), and 1015 g as petagrams (Pg). In general, we report C stocks and fluxes as the mass of C stored and transferred in C-containing molecules, except for the stocks and fluxes of CH4 for which we report the combined mass of C and H in the molecule.

The large-scale view of the Arctic system carbon cycle in this review considers (1) the stocks of carbon in the terrestrial and oceanic components of the Arctic; (2) the exchange of carbon dioxide (CO2) and methane (CH4) between the Arctic and the atmosphere; (3) the riverine transfer of carbon between terrestrial and oceanic components of the Arctic as dissolved organic carbon (DOC), dissolved inorganic carbon (DIC), particulate organic carbon (POC), particulate inorganic carbon (PIC), and CH4; and (4) the exchange of DOC, DIC, and CH4 between the oceanic component of the Arctic and the adjacent Pacific and Atlantic Oceans.
The terrestrial ecosystems of the Arctic, which generally consider vegetation of the tundra and boreal biomes, cover approximately 25% of the earth's vegetated land surface and contain about one third of the global terrestrial ecosystem C total, which includes approximately 40% of the world's near-surface labile soil C inventory (McGuire et al. 1995). The exchange of CO2 and CH4 between terrestrial ecosystems and the atmosphere is spatially and temporally complex, as demonstrated by a number of atmospheric inversion, inventory, and process-based studies (Kurz and Apps 1999, Dargaville et al. 2002a, b, Shvidenko and Nilsson 2002, Sitch et al. 2007). The interactions of C cycling processes with changes in atmospheric CO2, climate, permafrost dynamics, and disturbance regimes (fire, insects, logging, among others) contribute to this complexity, and these issues have not been comprehensively treated across the terrestrial component of the Arctic. Additionally, northern high-latitude terrestrial regions include a substantial area of CH4 emitting wetlands that act as a significant biogenic source of CH4 to the atmosphere (Zhuang et al. 2004).
The C cycle of the Arctic Ocean basin is dominated by the exchange of C with the Pacific and Atlantic Oceans and internal biogeochemical cycling (Lundberg and Haugan 1996, Anderson et al. 1998b). The C budget of the Arctic Ocean is also substantially influenced by riverine and coastal sources of organic C (Anderson et al. 1998b, Stein and Macdonald 2004). The annual air–sea exchange of CO2 across the surface of the Arctic Ocean is limited by the relatively small basin size and significant ice cover (Chen et al. 2003). While the net Arctic Ocean air–sea flux appears to be relatively small, studies have identified very significant regions of large air–sea CO2 flux in the surrounding high latitude ocean basins (Takahashi et al. 1993, 2002), with a strong seasonal cycle that is modulated by ice cover, physical and biological changes in the upper ocean, and variations of the partial pressure of CO2 in the overlying atmosphere. As such, the sources and sinks in these surrounding basins are particularly important for the interpretation of the estimates from atmospheric inversion model studies. Regarding CH4 exchange, previous global assessments have identified the Arctic Ocean as a significant net source of CH4 to the atmosphere (IPCC 2001).
The riverine transport of organic C from drainage basins to the world ocean is a major component of the global C cycle (Meybeck 1982). The drainage basin of the Arctic (∼24 × 106 km2) processes about 11% of the global runoff (Lammers et al. 2001), and the corresponding riverine flux of C from the pan-arctic watershed to the Arctic Ocean is one key connection between the terrestrial and marine components of the C budget in the Arctic (Guo et al. 2007). Freshwater discharge has increased for some Arctic rivers during the last century (e.g., Peterson et al. 2002, Serreze et al. 2006). Relative to other ocean basins, rivers play a disproportionately important role in the Arctic Ocean, which contains only about 1% of the world's ocean volume yet receives approximately 10% of the global terrigenous DOC load (Opsahl et al. 1999). This large delivery to the Arctic Ocean produces DOC concentrations in coastal waters that are twice as high as the corresponding concentrations in the Atlantic and Pacific Oceans (Cauwet and Sidorov 1996). Furthermore, while total export of riverine organic matter averages 1% of global terrestrial net primary production, the export of riverine organic matter from Arctic peatlands is as large as 15% of peatland net primary production (Waddington and Roulet 1997). Riverine fluxes of DIC have been given less attention in the C budget of the Arctic, yet contribute substantially to the total C flux from Arctic rivers (Striegl et al. 2007). The Arctic is also exceptional in the disproportionate role that coastal erosion plays, both presently and as a component especially vulnerable to climate change. In total, the entry of POC to the Arctic Ocean from coastal erosion is equivalent to that from rivers (Stein and Macdonald 2004).
Another unique aspect of the C cycle of the Arctic is the existence of large stocks of CH4 hydrates in permafrost on both land and the continental shelves of the Arctic, as well as beneath the floor of the Arctic Ocean Basin (Corell et al. 2008). Methane hydrates are ice-like solids consisting of a lattice of hydrogen-bonded water molecules forming cage-like structures, each of which contain a single molecule of CH4. The unique molecular structure of CH4 hydrate is very concentrated such that one unit volume of CH4 hydrate expands approximately 160 times when dissociated to CH4 gas in response to warming temperature or decreasing pressure. Methane hydrate is stable within geologic settings where relatively high pressures and cold temperatures exist. Global estimates of the abundance of CH4 hydrate vary widely, but they all indicate that the amount of C stored within marine and terrestrial CH4 hydrate deposits is enormous (Kvenvolden and Lorenson 2001, Milkov 2004) and may rival all conventional and unconventional hydrocarbon sources combined. A number of researchers have speculated that past periods of rapid atmospheric warming may have been initiated or significantly accelerated by the release of CH4 from dissociating CH4 hydrate deposits (Kvenvolden 1988, 1993, Dickens 2003).
What Are the Contemporary Carbon Stocks in the Arctic?
Terrestrial stocks excluding gas hydrates
In terrestrial environments, C from biotic activity is predominantly stored in two large reservoirs, soil organic matter (soil C) and living biomass (vegetation C). Carbon from past biotic activity is also stored in calcareous rocks (limestone, dolomite) as calcium carbonate, which can influence the DIC content of rivers, and in fossil fuel reservoirs well beneath the surface. Finally, C in terrestrial environments is stored beneath and within permafrost in CH4 hydrates. In this section, we focus our analysis on terrestrial C stocks in the soil and vegetation C pools.
The role of northern high latitude terrestrial ecosystems in the global C cycle has long been of interest because of the large stocks of soil organic C in the region. Soils in high latitude ecosystems are generally considered to have been storing large quantities of C in unglaciated regions prior to the last glacial maximum (Zimov et al. 2006a, b) and also in areas that have since been deglaciated since the last glacial maximum (Harden et al. 1992). In general, this accumulation is considered to have been promoted by cold and wet soils that inhibit decomposition of dead plant tissue that enters the soil organic matter pool. There is a considerable range in the estimates of soil C stored in high-latitude regions because of several issues associated with soil depth. First, estimates are based on the analysis of C in soil profiles, and different analyses consider different depth ranges in assessing soil stocks. Second, large stores of C are found in high latitude peatlands, where the depth distribution of peat has not been well quantified. Finally, there are large uncertainties in estimating the substantial C that has accumulated in permafrost prior to the last glacial maximum.
In general, organic C stocks in the upper 1 m of soil of global terrestrial ecosystems is estimated to be between 1400 and 1600 Pg (Bajtes 1996), but this estimate increases to around 2400 Pg if the upper 2 m of soil are considered (Bajtes 1996). Recently, it has been estimated that non-peatland vegetation types of northern high latitude regions contain 750 Pg C in the upper 3 m (Schuur et al. 2008). Estimates of C stocks in northern peatlands range from 200 to 450 Pg depending on whether the average depth of peatlands is considered to be 1.0 or 2.3 m (Gorham 1990, 1991). Turunen et al. (2002) estimated C stored in northern peatlands to range between 270 and 370 Pg. However, a recent study, which estimates that approximately 150 Pg C is stored in Canada's peatlands (Tarnocai 2006), is consistent with the 450 Pg C estimate of Gorham (1991) since about a third of the area of northern high latitude peatlands occurs in Canada. A study by Zimov et al. (2006a) argues that there are large amounts of C that accumulated in now-frozen soils of unglaciated regions prior to the last glacial maximum. This analysis, which assumes an average depth of 25 m, estimates that approximately 400 Pg C is stored in frozen loess soils of Siberia in what was formerly steppe-tundra vegetation during the Pleistocene. It has also been estimated the another 250 Pg C is stored in deep alluvial sediments below 3 meters in river deltas of the seven major Arctic rivers (Schuur et al. 2008). From the above-mentioned studies, a high estimate of northern high latitude soil C storage might include 1000 Pg C in non-peatland soils and deep alluvial sediments (Schuur et al. 2008, Tarnocai et al. 2009), 450 Pg C in peatlands (Gorham 1991), and 400 Pg C in frozen loess soils of Siberia (Zimov et al. 2006b), while a low estimate might include the 1000 Pg estimate from Schuur et al. (2008), the 200 Pg C low peatland estimate of Gorham et al. (1990) and half of the Zimov et al. (2006b) estimate of C in frozen soils. Based on these sums, we estimate soil C storage of northern high latitude terrestrial ecosystems to be between 1400 and 1850 Pg. The recent estimate of 1672 Pg C in soils of the northern circumpolar region (Schuur et al. 2008, Tarnocai et al. 2009) falls within this range.
In comparison with soil organic matter storage, C stored in vegetation of global terrestrial ecosystems is much less, with estimates ranging from 350 to 540 Pg C (Prentice et al. 2001). For forests in northern high latitudes, analyses that have taken stand-age distribution into account estimate that vegetation C storage of boreal forests are ∼45 Pg C in Russia (Shvidenko and Nilsson 2003), ∼12 Pg C in Canada (Liski et al., 2003), ∼2 in Fennoscandia (Liski et al. 2002), and about 5 Pg C in Alaska (Balshi et al. 2007). Based on these studies, we estimate that vegetation C storage in northern high latitude terrestrial regions is currently between 60 and 70 Pg C. The true uncertainty is likely larger than 10 Pg C because of uncertainties in estimating belowground biomass, primarily coarse and fine roots (Li et al. 2003).
Ocean stocks excluding gas hydrates
Water column
The world's ocean C inventory is dominated by high concentrations of inorganic C (>2000 μmol/kg seawater) in the water column. Inorganic C originates from air–sea exchange, river runoff, and to a lesser degree, dissolution of carbonate-containing minerals, decay of organic matter, and biological respiration. A relatively small, but detectable, fraction of the ocean's inorganic C inventory has accumulated from the increase of atmospheric CO2 associated with the burning of fossil fuels (Anderson et al. 1998a, 2000). The world's oceans also contain substantial concentrations of organic C (35–150 μmol/kg seawater). Organic C in the ocean originates from both terrestrial sources (river runoff, coastal erosion, atmospheric deposition) and marine primary production. Within the ocean, inorganic and organic C can occur in both particulate (PIC and POC) and dissolved (DIC and DOC) phases. The DOC, POC, and PIC fractions in the water column vary seasonally, especially in the surface water. This strong seasonal signal creates a wide variance in any estimate of DOC, POC, or PIC. However, because the C inventory is dominated by DIC, which has much lower seasonal variability, the overall C inventory varies only by about 5% seasonally.
Seawater entering the Arctic Ocean from both the Pacific Ocean through Bering Strait and from the Atlantic Ocean through Fram Strait and the Barents Sea is diluted in summer by both sea ice meltwater and by river runoff. Even though DIC varies substantially with salinity, with open ocean concentration being ∼2150 μmol/kg at salinity 35‰, a linear relationship between salinity and DIC cannot be applied in the Arctic Ocean as the two sources of freshwater have different DIC concentrations. Based on the observed concentrations of DIC and DOC of water masses with different salinities (Anderson et al. 1998b, Anderson 2002), we estimate DIC stocks of 310 Pg C and DOC stocks of 9 Pg C for the Arctic Ocean, including the shelf seas but not including the Nordic Seas or the Bering Sea (Table 1).

The particulate C content of the Arctic Ocean is characterized by substantial seasonal variability. There are a few plankton species that produce PIC, i.e., calcium carbonate shells, in the Arctic Ocean. Calcifying plankton like coccolithophorids are common in the Norwegian Sea and during the last few decades blooms have also been observed both in the Bering Strait and in the Barents Sea (Smyth et al. 2004). However, PIC content is very low within the water column of the Arctic Ocean and appears also to be a small component of settling particles (O'Brien et al. 2006). Marine POC, on the other hand, builds up to significant levels in the shelf seas. Thus, PIC is negligible in the Arctic Ocean C budget but POC may not be. However, the POC content of the water column is very difficult to estimate and it is thus not possible to include it in the general budget we have developed for this review.
The first published measurements of CH4 in the Arctic Ocean were made during open water in the Beaufort Sea (Macdonald 1976) where it was found to be near equilibrium with the atmosphere (∼3.5 nmol/L) in surface waters but considerably above saturation near the sea bottom (up to 50 nmol/L), which implies that sediments are a major source of CH4 to shelf waters. Based on these data, we estimate an inventory of approximately 0.4 Gg CH4 for Canadian Beaufort Shelf water (64 000 km2; mean depth 42 m). Kvenvolden et al. (1993b) observed generally higher concentrations (11–112 nmol/L) in late winter over the Alaskan shelf, which they proposed were due to buildup during the winter when air–sea exchange was prohibited by the ice cover. More recently, Shakhova et al. (2005) measured CH4 for the East Siberian and Laptev Seas in the summers of 2003 and 2004, showing both areal and vertical patchiness in concentration, with ranges in surface concentration from 2 to 110 nmol/L and an average of about 12 nmol/L, with higher concentrations at depth (up to 154 nmol/L in 2004). From these data, Shakhova et al. (2005) estimated inventories of 5.7 and 1.6 Gg CH4 for 2003 and 2004, respectively, in their study area (∼160 × 103 km2). The inventory of CH4 in the shelf seas clearly varies with season, depending on ice cover and plume distribution, but we can embrace most measurements by taking saturation (∼4 nmol/L) as the lowest value and 240 nmol/L as an upper value (e.g., Macdonald 1976, Damm et al. 2005, Shakova et al. 2005). Based on Jakobsson's (2002) volume estimate for redefined constituent seas (0.65 × 10⁶ km3), we estimate a shelf inventory of 0.1–2.5 Tg CH4.
There are fewer measurements for CH4 in the deep Arctic Ocean away from seeps or shelves, and the available data indicate that water column CH4 of the Arctic Ocean Basin is at or less than atmospheric equilibrium (Macdonald 1976, Damm et al. 2005), which agrees with measurements from other oceans (Conrad and Seiler 1988, Holmes et al. 2000). Elevated CH4 concentrations may be observed in the upper ocean (∼300 m) associated with particles and bacterial methanogenesis (Karl and Tilbrook 1994, Holmes et al. 2000), although we assume the interior Arctic Ocean (under the permanent ice pack) to be a poor location for such CH4 production due to the low productivity and associated particle flux (O'Brien et al. 2006). Accordingly, a basin CH4 concentration range of 1–4 nmol/L together with basin-water volume of 12.3 × 10⁶ km3 implies an inventory of 0.2–0.8 Tg CH4. Sea ice, which excludes dissolved gases during freezing, likely contributes negligibly to the CH4 inventory. We combine our estimates of the shelf inventory and the basin inventory to estimate that the Arctic Ocean and associated shelf seas have a CH4 inventory of between 0.3 and 3.3 Tg CH4.
Sediment
Enormous amounts of particulate C are stored in Arctic Ocean sediments, mainly in the shelf seas. Where sediments have accumulated for a sufficient time, some of the organic matter has been transformed to oil and gas (e.g., see Bakke et al. 1998: Fig. 10.1) and in a number of areas into CH4 hydrates (e.g., see Kvenvolden 1988). Estimating the amount of C in Arctic sediments is somewhat arbitrary depending on the depth/age range of sediments used. We estimate the inventory of organic C residing in the sediment surface mixed layer (∼3 cm in the basins and 10 cm over the shelves and slopes) to be ∼7.8 Pg C (shelves) and 1.6 Pg C (basins). This inventory of 9.4 Pg C includes recent deposition and organic matter potentially in contact with biota, and therefore is potentially available for biological processing.
Terrestrial and marine gas hydrates
Gas hydrates can occur in both terrestrial and marine environments in the Arctic wherever the optimum temperature and pressure conditions exist for the formation of hydrate. Marine gas hydrates in the Arctic are those formed in water depths greater than 300 m in a manner similar to deposits described in other marine settings around the world. On land, gas hydrates are primarily associated with thick occurrences of permafrost (a minimum of 250 m). Approximately 20% of the land area of the northern hemisphere is underlain by permafrost (see Brown et al. 1998). Permafrost also underlies extensive shallow-water areas of the Arctic continental shelf (Rachold et al. 2007), where it was formed under terrestrial conditions but was subsequently submerged by postglacial rise in sea level. Stable gas hydrates can occur within the permafrost (intra-permafrost hydrates) as well as below its base (sub-permafrost hydrates).
The complex permafrost environment of the Arctic makes it very difficult to identify gas hydrates during regional geophysical surveys. Evidence for the occurrence of permafrost gas hydrate is mainly indirect and based on interpretation of well logs collected during the course of oil and gas exploration. Most inferred occurrences of permafrost gas hydrates are of sub-permafrost gas hydrates, and verified observations of intra-permafrost gas hydrates are much rarer. Based on laboratory observations of reconstituted samples and limited indirect field observations, a number of researchers have speculated that gas hydrate can occur in a metastable state in association with ice-rich permafrost (Yakushev 1989, Ershov et al. 1991, Dallimore and Collett 1995). This raises the possibility that gas hydrate can exist in permafrost settings at shallower depths than pressure-temperature equilibrium conditions would suggest.
The confidence in global volume estimates of gas hydrate in large part can be evaluated based on the quality and number of documented field surveys. Lorenson and Kvenvolden (2007) present the most comprehensive global inventory of gas hydrate occurrences currently available. They cite only 39 places worldwide where core samples have been collected and 116 locations where gas hydrate has been inferred from indirect geophysical or geologic evidence. Of these, only two core sites are reported from a terrestrial Arctic gas hydrate occurrence (Dallimore and Collett 1999, Mt. Elbert Science Team 2007) and one from an Arctic marine gas hydrate occurrence from west of Svalbard (Posewang and Mienert 1999). While significantly more field research has been undertaken since the compilation by Kvenvolden and Lorenson (2001), clearly any global estimate requires significant extension of a limited data set. Milkov (2004) reviews efforts by a number of researchers to compile global estimates of the in place volumes of gas hydrate occurring in both marine and permafrost environments. The review identifies a significant reduction in global estimates from values approaching or exceeding 10 000 Pg C proposed by early studies (e.g., Kvenvolden 1988) to between 500 and 2500 Pg C. Based on an estimate that the area of the Arctic Ocean and its adjacent shelf seas (∼20 × 106 km2) are approximately 5% of the world's oceanic area (∼375 × 106 km2), we estimate that Arctic Ocean hydrates contain between 30 and 170 Pg CH4.
Early estimates of CH4 hydrate in land-based permafrost soils, i.e., subterranean permafrost, ranged between 8 and 400 Pg C (Goritz and Fung 1994). Given that the global estimates have dropped by approximately a factor of four, we estimate that permafrost soils contain between 3 and 130 Pg CH4, primarily as sub-permafrost hydrate. The shelf areas of the Arctic Ocean and its adjacent subarctic seas also contain permafrost soils that have been submerged due to sea level rise since the last glacial maximum approximately 15 000 years ago. Similar to land-based permafrost soils, submerged permafrost soils may also contain substantial CH4 hydrates. Based on a shelf area of ∼5 × 10⁶ km2 for the Arctic Ocean and its adjacent shelf seas and an area of continuous permafrost of approximately 10 × 106 km2, we multiply the range of subterranean CH4 estimates by 0.5 to estimate that submerged permafrost contains between 2 and 65 Pg CH4, primarily as sub-permafrost hydrate.
What Are the Contemporary Carbon Fluxes in the Arctic?
Surface carbon dioxide exchange
Surface–atmosphere fluxes of trace gases can be estimated essentially by two complementary approaches, generally referred to as top-down and bottom-up approaches. The top-down approach is based on precise atmospheric concentration measurements of the trace gas under consideration. In this case the atmosphere is used as a natural integrator of the fluxes from the heterogeneous region of interest, which are reflected in spatial and temporal atmospheric concentration variations. In order to determine the surface-atmosphere flux from the atmospheric measurements, an inverse model of atmospheric transport has to be used. The uses and limitations of atmospheric inversion approaches to estimating CO2 exchange in northern high latitude regions have been recently reviewed by Dargaville et al. (2006). The bottom-up approach is based on in situ flux estimates in representative locations, which are scaled-up to the region of interest using a combination of GIS and remote-sensing data. Various procedures can be used to temporally extrapolate in situ measurements, and the tools available include diagnostic (e.g., Papale and Valentini 2003) and prognostic models (e.g., Sitch et al. 2003).
Atmospheric analyses of carbon dioxide exchange
Overall, current atmospheric inversion studies indicate that during the 1990s the Arctic region was on average a modest CO2 sink that is less than 0.5 Pg C/yr (Table 2). These estimates do not include fluxes from the European sector of the Arctic region (northern Europe and European Russia), which cannot be separately extracted from the global region layout defined by the TransCom inter-comparison experiment (Gurney et al. 2003). The atmospheric inversions indicate that these average surface–atmosphere CO2 fluxes are subject to substantial interannual variations (up to ±0.5 Pg C/yr) caused primarily by climate fluctuations and associated variation in wildfires on land CO2 exchange (Bousquet et al. 2000, Rödenbeck et al. 2003, Baker et al. 2006). The listed uncertainties in Table 2 are 1 standard deviation as estimated by the inversion procedure. In the case of multi-model averages, the listed uncertainty also includes the transport model error computed from the spread of the different model flux estimates (Baker et al. 2006). The uncertainty estimate for the flux from the entire Arctic has been computed as the geometric mean of the flux uncertainties of the three component regions. This yields a conservative uncertainty estimate, since potential uncertainty covariances among the three regions are neglected.

There are several important limitations associated with the inversion methodology, including the large computational resources required for the inversion of the atmospheric transport model and the imperfection in the numerical representation of sub-grid scale mixing processes (e.g., surface and planetary boundary layer dynamics, vertical transport in convective clouds). Furthermore, significant uncertainty in the model results stems from a sparse observational network (see Gurney et al. 2003), where individual measurements are of limited accuracy and precision and thus may not be representative of the appropriate temporal and spatial scale of the transport model. Furthermore, observations are often not readily comparable across monitoring networks due to differences in measurement techniques and the use of different standards. The most serious limitation of the top-down approach follows from the limited number of observations and the need to adequately represent sources and sinks with a relatively high spatial and temporal resolution. In general, there exists a very large number of possible surface source-sink configurations that are in principle consistent with the atmospheric observations. As such, the atmospheric observations alone are not sufficient to uniquely determine the sinks and sources of CO2 at the surface of the earth.
A recent evaluation of the atmospheric transport models employed in the TransCom experiment has indicated systematic biases in how most of the models represent the vertical dilution of the seasonal cycle of the CO2 concentration over the northern extratropical hemisphere (Stephens et al. 2007). These biases imply an overestimation on the order of 30% of the magnitude of the northern extratropical CO2 sink as inferred by the models when run in the inverse mode. Because the northern extratropical region represents area north of approximately 20° N, it is not clear if these biases also imply an overestimation of the atmospheric inversion estimates for the Arctic. We note that the high-resolution, time dependent inversion conducted by Rödenbeck et al. (2003) listed in Table 2 was performed with one of the models that showed a relatively small bias. For purposes of this review, we adopt the 0.0–0.8 Pg C/yr sink estimate for the Arctic from Baker et al. (2006), which has an uncertainty that is intermediate between Gurney et al. (2003) and Rodenbeck et al. (2003).
Estimates of terrestrial carbon dioxide exchange
The net exchange of CO2 of terrestrial ecosystems is generally determined by the net production of vegetation C by plants (photosynthesis minus plant respiration), the decomposition of organic matter, and the release of CO2 in fires that burn organic C stored in vegetation and soils. Global analyses indicate that vegetation of terrestrial ecosystems fix approximately 100 Pg C/yr through the process of photosynthesis and release about half of that to the atmosphere in plant respiration and about half in the decomposition of soil organic matter (McGuire et al. 1997). Tundra ecosystems are responsible for approximately 2% of this exchange, while boreal forest ecosystems are responsible for approximately 8% (McGuire et al. 1997). Freshwater systems serve to cycle C from terrestrial systems into marine systems and the atmosphere. In this section we summarize research that has evaluated the net exchange of CO2 from (1) tundra and boreal forest ecosystems, and (2) freshwater lake and river ecosystems during the last two decades.
1. Tundra and boreal forest ecosystems
Multi-year ground-based C budget analyses at arctic tundra and boreal forest sites show a high degree of spatial and temporal variability, making it difficult to ascertain whether these ecosystems as a whole are currently acting as longer-term sinks or sources for atmospheric CO2 (e.g., Schulze et al. 1999, Aurela et al. 2001, Hobbie et al. 2002). Studies have shown rather dramatic fluctuations in annual budgets over decadal time scales at both tundra and forest sites (Oechel et al. 2000, Barr et al. 2007, Dunn et al. 2007). Variability is high across tundra sites from the European Arctic (Heikkinen et al. 2004), Siberia (Corradi et al. 2005), Alaska (Kwon et al. 2006, Schuur et al. 2009), Greenland (Soegaard et al. 2000, Groendahl et al. 2007), Svalbard (Lloyd 2001), and northern Scandinavia (Aurela et al. 2004, Johansson et al. 2006).
The interannual and across-site variability of CO2 exchange in arctic tundra ecosystems is driven primarily by growing-season dynamics and moisture conditions. Growing-season rates of CO2 uptake by tundra ecosystems have been shown in several studies to be closely related to the timing of snow melt, with earlier snowmelt resulting in greater uptake of atmospheric CO2 (Aurela et al. 2004, Groendahl et al. 2007). The annual C budget is not only controlled by growing-season exchange, but to a large extent by the losses during the shoulder (snow melt/soil thaw and senescence/soil freeze) and winter seasons (Johansson et al. 2006). Pulse emissions during the thaw period (Nordstroem et al. 2001) and long warm autumns after senescence that result in respiratory C losses (Johansson et al. 2006) are examples of shoulder season processes that have been shown important for determining annual budgets. Overall, the studies conducted to date suggest that tundra regions in the Arctic are sources of C to the atmosphere under dry and mesic conditions (e.g., in well-drained settings or in warm and dry years) and are C sinks under wet conditions (e.g., in poorly-drained settings or in cold and wet years).
Given both the spatial and temporal variability and the scarcity of ground-based observations of C exchange in tundra ecosystems of the Arctic, Sitch et al. (2007) evaluated the use of remote-sensing and process-based approaches to estimate whether these ecosystems are acting as sources or sinks of atmospheric CO2. Analyses based on remote-sensing approaches that use a 20-year data record of satellite data in the late 20th century indicate that tundra is greening in the Arctic, suggesting an increase in photosynthetic activity and net primary production. Process-based modeling studies generally simulate a small net C sink for the distribution of Arctic tundra (e.g., between 3 and 4 Tg C/yr over the last 25 years of the 20th century in McGuire et al. 2000), a result that is within the uncertainty range of field-based estimates of net C exchange across all tundra ecosystems in the Arctic.
The current and future role of boreal forests in the global C budget is also uncertain. The substantial sink in boreal forests, as estimated from the “top-down” approaches described in Atmospheric analyses of carbon dioxide exchange, has been supported by inventory-based studies (e.g., Myneni et al. 2001), with C sequestration in these regions likely due to increased production resulting from enhanced CO2 uptake, increased nutrient availability and longer growing seasons. On the other hand, some analyses of boreal forest C budgets suggest decreasing production in recent decades as a result of drought stress, nutrient limitation and increased disturbance (see Goetz et al. 2005). “Bottom-up” regional estimates of net CO2 exchange between boreal forest ecosystems and the atmosphere have been developed by both inventory- and process-based models. While each of these approaches has different strengths and shortcomings, a comparison of estimates (Table 3) does provide some sense for the range of estimates.

Inventory-based analyses indicate that, in 1990, the Northern European region (Finland, Norway, and Sweden) stored approximately 5 Tg C/yr in soils and 19 Tg C/yr in trees (Liski et al. 2002). Inventory-based analyses also generally show that forests in Russia have been storing C in the late 20th century, with estimates ranging between approximately 300 and 500 Tg C/yr depending on the model and the time period analyzed (Myneni et al. 2001, Shvidenko and Nilsson 2003). Process-based analyses that consider fire as the only disturbance estimate a range of between neutral C exchange to a sink of around 300 Tg C/yr (Balshi et al. 2007), with the range depending on the time period analyzed and whether or not the model applications consider CO2 fertilization. Temporal analysis of Russian forest inventory data on leaves, wood, and roots during the last half of the 20th century indicates that the fraction of leaves is generally increasing (Lapenis et al. 2005), consistent with the satellite record in the late 20th century (Myneni et al. 2001). However, the fraction of wood and roots in Russia generally decreased in the last half of the 20th century, which suggests that analyses of changes in C storage based on the detection of green biomass by satellites may overestimate the sink of C in Russia (Lapenis et al. 2005).
Models based on forest inventory data indicate that, near the end of the 20th century, Canada was a C sink of between 50 and 100 Tg C/yr (Kurz and Apps 1999, Myneni et al. 2001, Liski et al. 2003). Process-based modeling approaches suggest that the range of estimates is slightly lower (from near neutral to a sink of 80 Tg C/yr; Chen et al. 2000, Balshi et al. 2007). For Alaska, process-based models estimate that terrestrial ecosystems stored between 5 and 12 Tg C/yr in the 1980s and between 0 and 9 Tg C/yr in the 1990s (Balshi et al. 2007). The range of uncertainty using estimated changes in C storage from process-based models depends in part on whether the models implement a response of photosynthesis to increasing atmospheric CO2 (i.e., CO2 fertilization; Zhuang et al. 2006, Balshi et al. 2007). While models generally estimate that boreal North America was a sink in the late 20th century, several studies suggest that the sink strength is decreasing and becoming a source as we move from the 20th to the 21st century because of increased disturbance (fire and insects) and drier summers (Kurz and Apps 1999, Goetz et al. 2005, Balshi et al. 2007, Kurz et al. 2008).
The combination of bottom-up estimates for tundra and boreal forest ecosystems of Canada, Alaska, Northern Europe, and Russia suggests that terrestrial ecosystems across the Arctic acted as a sink of 0–600 Tg C/yr near the end of the 20th century. A consideration of only the inventory-based estimates would put the range at between 300 and 600 Tg C/yr. The neutral exchange of the process-based estimates for the Arctic region is associated with an assumption that CO2 fertilization is not playing a role in C sequestration (Balshi et al. 2007). We accept the range of the inventory estimates (300 and 600 Tg C/yr) as our synthetic estimate of net uptake of CO2 in the late 20th century for terrestrial ecosystems of the Arctic region and conclude that CO2 fertilization is likely playing a role in C sequestration of the region.
2. Freshwater lake and river ecosystems
Inland waters are a major landscape feature of the Arctic, with lakes occupying as much as 48% of the land surface in some high latitude regions (Riordan et al. 2006), and with rivers of the pan-arctic drainage basin accounting for approximately 10% of global discharge (Forman et al. 2000). About 36% of the global surface area of lakes is contained in the region north of 45° N latitude, according to the Global Land Cover Characterization database (Loveland et al. 2000). Lakes and rivers play an important and active role in the global C budget as conduits of terrestrial organic matter to the ocean, as sources of both terrestrially and aquatically produced CO2 to the atmosphere, and as sinks of C stored in sediments and sequestered in aquatic production. While aquatic primary production can contribute to varying degrees, the C balance of freshwater ecosystems is dominated by inputs from land (Kling et al. 1991, Cole et al. 1994). By extrapolating per-area efflux measurements from their study on the North Slope of Alaska, Kling et al. (1991) estimate that CO2 evasion from arctic lakes and rivers is approximately 20 Tg C/yr for tundra in the Arctic.
A recent analysis by Cole et al. (2007) estimates that, globally, about half of the C input from terrestrial ecosystems is discharged to the ocean, with about 40% lost to CO2 efflux from the surface and 10% stored in sediments of inland waters. Algesten et al. (2003) found similar trends amongst a series of catchment studies in Scandinavian boreal lakes. With few data available for compiling a quantitative estimate of the evasion of CO2 from lakes and rivers throughout the Arctic, we down-scaled the global estimates based on the proportion of the global totals for lake area and river discharge represented in the pan-arctic. Of the global CO2 efflux estimates given in Cole et al. (2007), lakes contributed 70–150 Tg C/yr and rivers an additional 150–300 Tg C/yr. Our first-order estimates for pan-arctic CO2 evasion from inland waters, then, are between 25 and 54 Tg C/yr from lakes (based on 36% of the global lake area) and between 15 and 30 Tg C/yr from rivers (based on 10% of the global discharge).
There is considerable variability in C cycling processes within the inland waters of the pan-arctic that contributes to the uncertainty of our lake and river CO2 efflux estimates. In comparison to large lakes, the per-area flux of CO2 to the atmosphere is generally higher from smaller lakes (Christensen et al. 2007). In general, substantial losses of terrestrial C have been observed from small and medium sized lakes in both the subarctic (Jonsson and Karlsson 2003) and arctic environments (Kling et al. 1991, Eugster et al. 2003). These emissions have been found to have terrestrial organic C as substrates and many of the small lakes are therefore considered net heterotrophic and their C cycling is intimately coupled to terrestrial processes in the areas surrounding them (Kling et al. 1991). When measuring the CO2 balance of lakes there is a challenge in capturing large emissions that can occur in connection with ice break-up and the release of trapped gases in the spring. In comparison to tundra lakes, per-area surface emissions from lakes in the boreal forest are generally higher (Algesten et al. 2003). Reducing the uncertainty in our estimates of CO2 efflux from inland waters, then, requires increased sampling and field study of aquatic C cycling processes across lakes and rivers with diverse attributes, in addition to improved mapping of these attributes for extrapolating estimates over the pan-arctic.
Estimates based on ocean observations
While the Arctic Ocean is small compared to the global oceans, the per-area primary production and air–sea fluxes of CO2 are many times the global average, particularly in inflowing shelf seas like the Barents Sea and Bering-Chukchi Seas. The Pacific waters flowing through Bering Strait follow varied routes within the Arctic Ocean before entering the North Atlantic, making the Arctic Ocean an important transport path between these two major global oceans (Fig. 1). Another process specific to the Arctic Ocean is deep water formation, which transports dissolved organic and inorganic C from the surface ocean to the intermediate and deep waters. This circulation is globally important in sequestering anthropogenic CO2. Subsurface waters formed in this way constitute the headwaters of the Meridional Overturning Circulation, spreading water to all of the global oceans.
At present, the Arctic Ocean is undergoing rapid changes, including decreasing sea ice coverage (Stroeve et al. 2007), which have great potential to alter processes important to C exchange with the atmosphere. Both cooling and primary production promote a flux of CO2 from the atmosphere to the surface ocean. However, as much of the central Arctic Ocean surface is covered by sea ice, at least during the winter season, gas exchange is hampered even if it does not necessarily provide a completely impermeable barrier. Also, sea ice melt ponds and open brine channels might act as spring/summer CO2 sinks (Semiletov et al. 2004). One consequence of the seasonal ice cover is that the surface waters of the central Arctic Ocean are undersaturated with respect to CO2, which suggests that the loss of CO2 from surface waters through fixation and associated flux of organic C to deeper water exceeds the net physical flux of CO2 from air to sea.
Estimates of the air to sea CO2 flux have been made using budget computations and direct measurements of the difference in partial pressure of CO2 between the atmosphere and ocean surface and indicate that the uptake of CO2 by the Arctic Ocean is approximately 24 Tg C/yr (Anderson et al. 1998b). It should be noted, however, that our estimate for CO2 exchange of the Arctic Ocean is subject to bias because it has not accounted for interannual variability in the sub-domain estimates. Also, the sub-domain estimates are based on data that are incomplete with respect to sampling the variability of exchange in both season and space. The most comprehensive measurement campaign of the surface water pCO2 field was performed in 2002 and 2004 within the Shelf-Basin Initiative project (Bates 2006, Bates et al. 2006). The data show large variability in surface water pCO2 in both time and space. The mean computed air to sea fluxes were in the range 36 to 61 mmol·m−2·d−1 for the summer and fall investigations. The net annual air–sea flux estimated for the Chukchi Sea shelf from these data is 31–45 Tg C/yr (Bates 2006). It should be noted that spatial coverage of the Shelf-Basin Initiative project is limited with much of the data derived from the Alaska coastal region and the continental slope, and thus the uptake of deeper water may be overestimated. Nevertheless, the estimate of Bates (2006) suggests that the estimate of 24 Tg C/yr for the mean annual uptake of CO2 by the Arctic Ocean by Anderson et al. (1998b) could be substantially low because of seasonal, interannual, and spatial sampling/scaling issues. Given the estimates of Anderson et al. (1998b) and Bates (2006), we infer that the mean annual sink for atmospheric CO2 of the Arctic Ocean and its associated shelf seas lies between 24 and ∼100 Tg C/yr.
Part of the CO2 taken up by the surface ocean is transported to intermediate and deep waters by density increase due to cooling and/or the addition of salt from brine drainage during sea ice production. However, the steady state vertical transport of DIC or DOC is not as remarkable as the non-steady state anthropogenic contribution, which is equivalent to the differential amount that DIC has increased through equilibrating with an atmosphere of higher pCO2 from the burning of fossil fuel. The sink of anthropogenic CO2 was computed for the Arctic Ocean and its adjacent subarctic seas in 1991 to be 26 Tg C/yr by applying a plume entrainment model to measured data, with the inventory being 1350 Tg C (Anderson et al. 1998a). The Greenland Sea (one of the major deep water formation areas) sink of anthropogenic CO2 was computed to be 2.4 Tg C/yr for the year 1994 by a mixing box model constrained by CFCs (Anderson et al. 2000). None of these numbers are significant in a global context, but they are significantly larger when expressed per unit area. Furthermore, the processes behind the deep water formation are sensitive to environmental change, which potentially could considerably change these sinks. For example, the uptake of CO2 is potentially sensitive to changes in sea ice because the addition of brine from growing sea ice to the seawater provides an efficient means to transport CO2 enriched surface water to depth (Anderson et al. 2004).
Surface methane exchange
Atmospheric analyses
Estimates of CH4 emissions can be calculated with the top-down method from atmospheric measurements obtained by the global observation network (see Atmospheric analyses of carbon dioxide exchange), subject to the same limitations as discussed above for CO2. Furthermore, most inversion studies involving CH4 require specified a priori wetland emissions estimates derived from bottom-up approaches (e.g., Matthews and Fung 1991), which must be scaled down substantially in order to be compatible with the atmospheric concentrations (e.g., Bergamaschi et al. 2007). In addition to an a priori emission pattern, the inversion modeling system also needs to include the atmospheric sink of CH4 by oxidation with the OH radical. This is done by prescribing OH fields from atmospheric chemistry model simulations (e.g., Spivakovsky et al. 2000) that may be also optimized in the inversion. Alternatively, in a pre-inversion step, the OH fields may be independently optimized to match the global sink of methylchloroform (Bousquet et al. 2005). Space-borne remote-sensing methods have recently become a promising tool for improved mapping of the global atmospheric CH4 distribution (Frankenberg et al. 2005). Even though the satellite instruments measure only the column-integrated CH4 content in cloud-free areas with less accuracy than in situ measurements, the large amount of observations and the global coverage are distinct advantages, and the observations can be used in a top-down inversion system (Bergamaschi et al. 2007).
Recent inversion studies (Mikaloff Fletcher et al. 2004a, b, Bergamaschi et al. 2005, 2007, Chen and Prinn 2006) indicate that the Arctic is a source of CH4 to the atmosphere of between 15 and 50 Tg CH4/yr (Table 4). Atmospheric inversion studies indicate that there is substantial inter-annual variability of CH4 sources (Bousquet et al. 2006), with the interannual variability in the Arctic associated with climate variability. Bousquet et al. (2006) attribute a significant fraction of the recently observed slow-down in the global growth rate of CH4 in northern latitudes to a reduction of CH4 emissions from wetlands caused by a drying trend after 1999.

Estimates based on terrestrial observations excluding gas hydrates
Soils of terrestrial ecosystems have the capacity to both produce and consume CH4. Recent studies estimate that CH4 emissions from the world's soils range from 150 to 250 Tg CH4/yr (Prather et al. 2001), with one-quarter to one-third of the total emitted from the wet soils of high latitudes (Walter et al. 2001a, b). Estimates of global CH4 consumption by soil microbes are in the range of 10–30 Tg CH4/yr (Prather et al. 2001), an order of magnitude lower than the emission estimates. Most of the CH4 consumption occurs in the well-drained soils of temperate and tropical areas (Ridgwell et al. 1999). A wide range of observational studies has been conducted to quantify the rates of and controls on CH4 emissions from wet and mesic tundra ecosystems (e.g., Whalen and Reeburgh 1992, Christensen 1993, Christensen et al. 1995, 2000, Friborg et al. 2000, Corradi et al. 2005) as well as uptake by dry tundra ecosystems (Whalen and Reeburgh 1990a, Christensen et al. 1999). Earlier studies, only a few of which have been conducted in tundra regions, were reviewed by Bartlett and Harriss (1993). The process-level understanding gained through these studies has lead to a range of modeling efforts to investigate the effects of changing climate on CH4 emissions from tundra ecosystems (Cao et al. 1996, Walter and Heimann 2000, Zhuang et al. 2004, Sitch et al. 2007).
Emission estimates of CH4 from northern high latitude terrestrial ecosystems in the late 20th century range from 31 to 106 Tg CH4/yr (Table 5), but estimates published since 1998 range between 31 and 65 Tg CH4/yr. Consumption estimates are much less, and range from 0 to 15 Tg CH4/yr. The combination of the consumption and emissions estimates published since 1998 results in a range of 16–65 Tg CH4/yr for net CH4 emissions. A process-modeling study by Zhuang et al. (2004) places the annual net emission rate at the end of the century for the region north of 45° N at 51 Tg CH4/yr.

The atmospheric fluxes of CH4 from lakes may have been under-represented in early attempts to estimate global CH4 emissions (Matthews and Fung 1987). It has recently been estimated that thermokarst lakes are responsible for substantial CH4 emissions (Walter et al. 2006). These subarctic and arctic lake systems in Siberia and Alaska are surrounded by permafrost soils that are rich in C accumulated during the Pleistocene. A broad lake survey by Bastviken et al. (2004) has also reported significant CH4 emissions from boreal, subarctic, and arctic lakes, with smaller lakes generally having much higher emissions than larger lakes. Thus, the scaling-up of CH4 measurements from lakes requires differentiation between (1) small and large lakes and (2) the presence or absence of permafrost (Bastviken et al. 2004, Walter et al. 2006). Few studies have attempted to scale-up lake CH4 fluxes for northern high latitudes, but recently Walter et al. (2007), using data from Siberia, Alaska, and the literature, estimated that lakes in this region (excluding large lakes with likely small emissions) emit 15–35 Tg CH4/yr. If there has been no double-accounting between the emissions estimates of Walter et al. (2007) and the emissions estimates in Table 5 that have been published since 1998, the bottom-up estimates of net CH4 emissions for the Arctic range between 31 and 100 Tg CH4/yr.
Emissions from CH4 exchange associated with CH4 hydrate
CH4 hydrate can occur both below and within permanently frozen soil. Permafrost has low permeability due to the presence of ice within the sediment pores and thus impedes the vertical migration of free gas. However, this permeability is temperature dependent and increases up to five orders of magnitude as permafrost warms to 0°C (Williams 1982). Thermal dissociation of gas hydrate associated with permafrost is thought to be widespread along the Arctic coastline where the continental shelf has been warmed by ocean transgression (Kvenvolden et al. 1993a, Paull et al. 2007). In this case there has been significant time to dissociate some gas hydrate and increase the permeability of the permafrost interval by warming. Thermal modeling has illustrated that, in comparison to continental slope hydrates, gas hydrate in terrestrial permafrost responds much slower to climatic warming. Some exceptions do occur where thawed zones, or taliks, exist beneath large lakes or river channels. In some of these settings, e.g., in the Mackenzie Delta of Canada, vigorous gas seepage is known to occur. It is speculated that these features are connected to deeper gas sources via faults or gas-saturated groundwater advection. To our knowledge, there is no estimate of CH4 emissions associated with the dissociation of gas hydrate in or below subterranean permafrost.
Wuebbles and Hayhoe (2002) have estimated that global CH4 emissions associated with the dissociation of gas hydrate are 5 Tg CH4/yr, with an uncertainty range between 0.4 and 12.2 Tg CH4/yr. We use the ratio of the area of continuous permafrost (approximately 10 × 106 km2; Zhang et al. 1999) to the area of global ocean plus continuous permafrost ([375 + 10] × 106 km2) to develop the first-order estimate of between 0 and 0.3 Tg CH4/yr emitted from the dissociation of gas hydrate associated with subterranean permafrost in the Arctic. This range does not affect our overall estimate of between 31 and 100 Tg CH4/yr emitted from terrestrial regions of the Arctic. Similarly, a prorating of the global 14 Tg CH4/yr emissions of Wuebbles and Hayhoe (2002) from other natural geological sources, such as volcanoes, to the Arctic would not affect our overall estimate of terrestrial CH4 emissions.
Emissions based on ocean observations
Establishing CH4 fluxes for the Arctic Ocean is difficult because the very few available observations are characterized by high seasonal and spatial variability. Sources of CH4 to the Arctic Ocean include inflow from the Pacific Ocean, diffusion of microbially produced CH4 in near-surface sediments, bubble seeps from deep sediments, riverine inflow, and in situ production in particulate organic matter. Methane leaves the Arctic Ocean system via the archipelago outflow through net exchange with the atmosphere and by oxidation within the ocean. Exchange with the Atlantic Ocean via Fram Strait and the Barents Sea may provide a net source or sink for Arctic Ocean CH4. Many of these processes are presently difficult to quantify due to a lack of data; for example, oxidation within the ocean is presently un-quantified but may be significant (Kvenvolden et al. 1993a, Damm et al. 2005), and the bubbling of CH4 proves an elusive process to quantify.
Several estimates have been made for CH4 flux from Arctic shelf waters to the atmosphere, including for the Alaskan shelf (∼0.016 g/m2; Kvenvolden et al. 1993a) and for the Laptev and East Siberian shelves (1.0–2.6 × 10⁴ g/km2; Shakhova et al. 2005, Shakhova and Semiletov 2007). Prorating these fluxes to the entire Arctic shelf (5 × 10⁶ km2) implies a source of 0.08–0.13 Tg CH4/yr. The flux to the atmosphere, which does not include potentially higher fluxes associated with river plumes or polynyas, must at least be supported by a corresponding seabed flux into the bottom water. Damm et al. (2007) recently provided an Arctic-wide estimate for CH4 evasion from polynyas of 0.005–0.020 Tg/yr, which does not affect the estimated range that we present here. Methane bubbles, which bypass flux estimates based on concentration gradients, are likely an important vertical transport mechanism in the shelf water of the Arctic Ocean (e.g., Shakhova et al. 2005, Paull et al. 2007), but perhaps less so in deeper water where dissolution feeds the deep-ocean reservoir (Damm and Budéus 2003). Hovland et al. (1993) have set the global seepage of CH4 from continental shelf sediments (27.4 × 10⁶ km2) at 1–50 Tg CH4/yr, which would imply an Arctic shelf flux to the atmosphere of 1–12 Tg CH4/yr. It is possible that the discrepancy between this number and measured flux estimates can be explained by bubble transport. We assume that this estimate encompasses CH4 emissions associated with the dissociation of gas hydrate throughout the Arctic Ocean and associated shelf seas.
Lateral fluxes and fates of DOC, DIC, POC, and CH4
Exchange between the Arctic and adjacent oceanic basins
In estimating the exchange of DIC, DOC, POC, and CH4 of the Arctic Ocean with the Atlantic and Pacific Oceans, we assume that the exchange is approximately balanced. That is, the (1) inflow from the North Atlantic through the Nordic Seas is offset by southward flows through North Atlantic Deep Water and the surface water of the East Greenland Current and (2) inflow through the Bering Strait is balanced by the southward flow through the Canadian Arctic Archipelago. On the order of 8 Sv (1 Sv = 106 m3/s) of warm, saline water flows into the Nordic Seas from the North Atlantic over the Greenland Scotland Ridge (Hansen and Østerhus 2000). A similar volume is transported south into the North Atlantic through a bottom current of about 6 Sv and through a surface flow of about 2 Sv in the East Greenland Current. The Central Nordic Seas act as a mixing point for waters of Atlantic and Arctic origin where some of the warm Atlantic water mixes with the south flowing East Greenland Current before making it into the Arctic Ocean. Of the water entering the Nordic Seas, about 2 Sv continues into the Arctic Ocean over the Barents Sea, while a large volume flux passes north through Fram Strait. This latter flux has been reported to be on the order of 10 Sv (Schauer et al. 2004), which means that there must be a substantial recirculation within the Nordic Seas. Water also enters the Arctic Ocean from the Pacific Ocean through the Bering Strait, at a mean volume flux of 0.8 Sv (Roach et al. 1995, Woodgate et al. 2005). Roughly an equal amount has been suggested to exit the Arctic Ocean through the Canadian Arctic Archipelago (Prinsenberg and Hamilton 2005).
The DIC concentration in seawater is fairly high (typically above 2000 μmol/kg H2O). The approximately 8 Sv that enters the Nordic Seas from the Atlantic Ocean is responsible for a DIC transport of about 1 Pg C/yr. The in-flux through Bering Strait is estimated to be approximately an order of magnitude lower (0.1 Pg C/yr). DOC concentrations from inflowing Atlantic water have been measured in the range of 52–75 μmol/L (Børsheim and Mycklestad 1997, Wheeler et al. 1997, Opsahl et al. 1999, Fransson et al. 2001). Multiplying this average concentration with the 8-Sv flux gives a DOC inflow of between 21 and 30 Tg C/yr. The DOC concentration in the waters passing the Bering Strait is more variable, with values reported in the range of 34–134 μmol/L H2O (Walsh et al. 1997, Wheeler et al. 1997). Based on a water transport of 0.8 Sv, the influx of DOC through the Bering Strait is estimated to be between 1 and 5 Tg C/yr. The exchange of POC between the Arctic and adjacent ocean basins is likely several orders of magnitude less than the exchange of DOC, and can be considered negligible.
A reasonable range of estimates for CH4 concentration of Pacific inflowing water through the Bering Strait is 4 to 20 nmol/L, which implies a flux into the Arctic of 2–8 Gg CH4/yr using a volume transport of 0.8 Sv (Roach et al. 1995). There are no data for quantifying the exchange of CH4 between the North Atlantic and Arctic Ocean, but assuming that it is approximately an order of magnitude higher than the Bering Strait exchange implies an exchange of between 20 and 80 Gg CH4/yr.
Riverine fluxes
There has been substantial progress in the last few years to improve the database for estimating the export fluxes of DOC, DIC, and POC to the Arctic Ocean (Guo and Macdonald 2006). The current understanding of export fluxes for Arctic rivers is summarized in Table 6. The total freshwater discharge of the pan-arctic drainage basin (16 × 106 km2) is approximately 3500 km3/yr. Based on this water flux and a discharge-weighted average DOC concentration of 9.4 ppm, we estimate the total export fluxes of C from rivers to the Arctic Ocean to be 43 Tg C/yr as DIC, approximately 33 Tg C/yr as DOC, and about 6 Tg C/yr as POC. Black carbon, a result of the incomplete combustion of either fossil fuel or biomass, is 0.03–0.10% of POC in the seven largest rivers of the Arctic (Guo et al. 2004, Elmquist et al. 2008). This implies that the flux of black carbon, which is very difficult for microbes to decompose, to the Arctic Ocean is between 0.2 and 0.6 Tg C/yr. These fluxes are likely overestimated for DIC and underestimated for DOC and POC because of the disproportional partitioning in discharge and DOC concentration (Finlay et al. 2006, Raymond et al. 2007, Cai et al. 2008). Arctic rivers have a high seasonal variability in discharge, with the concentration of DIC decreasing and DOC and POC increasing during high flows (e.g., from melt water in the spring). Thus, inadequate sampling during peak flows of the spring river ice breakup have tended to overestimate DIC flux and to underestimate discharge-weighed DOC and POC flux (by between 20% and 60%; Finlay et al. 2006, Guo et al. 2007, Raymond et al. 2007, Cai et al. 2008).

Carbon can also enter the Arctic Ocean as particulate inorganic carbon (PIC) and CH4, but there are very few data on either PIC or CH4 concentrations in river water. Recent studies of the Yukon River have documented a PIC/DIC flux ratio of 0.10 and a PIC/POC ratio of 0.67 (Striegl et al. 2007), which would imply a PIC flux of 3 to 4 Tg C/yr if these ratios were applied throughout the pan-arctic drainage basin. However, it is likely that PIC export is much lower since the PIC/POC ratio of the Yukon River is probably only representative of the MacKenzie River, which dominates the sediment budget of the Arctic Ocean with a sediment load that is largely derived from limestone rich mountains. With respect to CH4, it is likely that rivers are at or above equilibrium with the atmosphere and that higher concentrations are obtained during ice cover. Assuming river concentrations of 10–200 nmol/L (Semiletov et al. 1996, Galimiov et al. 2006), together with a total river inflow of 3253 km3/yr (Serreze et al. 2006), implies an input of 1 to 11 Gg CH4/yr to the Arctic Ocean from rivers. River plumes may be locally important for CH4 surface concentrations (e.g., see Shakhova et al. 2005, Shakhova and Semiletov 2007), but they contribute little to the Arctic Ocean budget.
Coastal and atmospheric POC inputs
Coastal erosion in the Arctic is an important source of POC to the Arctic Ocean, and this flux is likely to increase with warming because of enhanced erosion associated with the loss of a protective sea ice buffer, increasing storm activity, and thawing of coastal permafrost (e.g., Rachold et al. 2000, 2004, Jorgenson and Brown 2005). Based on recent estimates by Rachold et al. (2004), POC transport across the Arctic land/ocean interface through coastal erosion is in the order of 6–7 Tg C/yr (Table 7). POC fluxes from coastal erosion are equivalent to riverine POC fluxes, but much smaller than riverine DOC fluxes. The total supply of POC to Arctic shelves from wind erosion, which has been estimated to be approximately 2 Tg C/yr by Stein and Macdonald (2004), is highly uncertain. Similarly, fluxes of atmospheric black carbon soot from boreal wildfires and fossil fuel combustion are highly uncertain. In this review we also do not explicitly consider the wind driven exchanges of POC like black carbon between the Arctic and regions outside the Arctic. Although black carbon deposition is most likely a quantitatively minor component of total C transport across the land/ocean interface (Kim et al. 2005, Elmquist et al. 2008), its deposition on high albedo surfaces like snow and sea ice has potentially important consequences for energy exchange in the Arctic (Hansen and Nazarenko 2004).

Transport and fate of terrestrially derived carbon
The fate of terrestrial organic C during its transport in arctic rivers and within the Arctic Ocean remains uncertain and largely unknown (Stein and Macdonald 2004). One potential pathway could be the direct mineralization of river DOC to DIC, resulting in a CO2 flux across the river/atmosphere interface (e.g., Kling et al. 1991, Mayorga et al. 2005). Laboratory incubation studies have identified that a significant fraction of soil DOC can be degraded (Neff and Hooper 2002, Cleveland et al. 2004). However, the contribution of riverine DOC to CO2 out-gassing in river systems of the Arctic has not been well quantified, and our estimate of 15–30 Tg C/yr is based on some very simple assumptions (see Freshwater lake and river ecosystems).
Recent measurements of 14C ages for organic C in rivers collectively show that DOC tends to be contemporary, while POC is older (Guo and Macdonald 2006). These observations suggest that changes in climate will have different effects on the sources of DOC and POC, with DOC responding to how changes affect the release of soil organic C of recent origin and POC responding to effects on the release of older soil organic C that is currently stored in permafrost (Guo et al. 2007). Based on the assumption that old organic C is mostly derived from river bank soils, Guo and Macdonald (2006) estimated that 78% of Yukon River POC came from old soil organic C, whereas all high molecular weight DOC, which comprises about 70% of bulk DOC, was derived from modern terrestrial organic C.
DOC exhibits conservative mixing in Arctic estuaries and coastal regions (Cauwet and Sidorov 1996, Dittmar and Kattner 2003, Guéguen et al. 2005, 2007), which suggests little removal during initial transport. However, DOC is not likely to be conserved during its transport through the Arctic Ocean. Hansel et al. (2004) estimate a half-life of 7.1 years for terrestrial DOC in the Arctic Ocean, with microbial activity and reactions with light the most probable causes of degradation.
The fate of terrestrially derived POC in the Arctic Ocean is less clear. Although the total terrestrial supply of POC to the Arctic Ocean is much lower than total marine production, this source can be important near points of entry (river mouths and shorelines; Telang et al. 1991, Naidu et al. 2000, Macdonald et al. 2004). For example, at the Beaufort Shelf edge, a location in proximity to terrestrial POC sources, settling particles contained 15–35% C of terrestrial origin (O'Brien et al. 2006). Stein and Macdonald (2004) estimate that shelf and basin sediments capture 8.7 Tg C/yr and 2.4 Tg C/yr, respectively, of ocean water column POC. A further breakdown assigns 36% of the shelf burial as marine-derived POC compared to 20% in the basin, which suggests that the sediments of the Arctic Ocean have a stronger imprint of terrestrial POC than sediments of other oceans.
Global Context of the Contemporary Carbon Cycle of the Arctic
Substantial stocks of C are stored in the Arctic (Fig. 3). Our estimate of between 1400 and 1850 Pg C soil organic matter stored in both surface (0–3 m) and deeper soils is more than half of global estimates that only consider surface soil (e.g., 2300 Pg C estimated for 0–3 m by Jobbagy and Jackson 2000). Much of this soil organic C is stored in peatlands and deep permafrost soils in Siberia. Most of this storage has accumulated because of wet and cold physical conditions that are not conducive to the decomposition of soil organic matter. Between 10% and 20% of the world's vegetation C occurs in the Arctic, with most of this storage as tree biomass in the boreal forests of the region. There are large stocks of DIC in the Arctic Ocean, and approximately 1% of this storage is derived from fossil fuel emissions that have entered the atmosphere. It is speculated that there are substantial stocks of CH4 stored as gas hydrate beneath the ocean floor and beneath both subterranean and submerged permafrost of the Arctic, but there is large uncertainty about the magnitude of these stocks; our back-of-the-envelope estimates place the storage at between 35 and 365 Pg CH4.

The current state of the Arctic carbon cycle based on a synthesis of the information presented in this review. Values shown are the ranges of uncertainty.
Our review indicates that the Arctic plays an important role in the global dynamics of both CO2 and CH4. Top-down atmospheric analyses indicate that the Arctic is a sink for atmospheric CO2 of between 0 and 0.8 Pg C/yr (Fig. 3), which is between 0% and 25% of the net land/ocean flux of 3.2 Pg C/yr estimated for the 1990s by the IPCC's Fourth Assessment Report (AR4; Denman et al. 2007). The 0.3–0.6 Pg C/yr that we estimate for the land sink of the Arctic is 30–60% of the 1.0 Pg C/yr global net land sink estimate for the 1990s, and the 24 to 100 Tg/yr sink we estimate for the ocean sink of the Arctic is 1–5% of the 2.2 Pg C/yr net ocean sink estimated globally by AR4 for the same time period (Denman et al. 2007). As such, our synthesis of the CO2 flux studies reviewed here indicates that the growth of trees in the boreal forest is responsible for most of the sink activity in the Arctic.
Atmospheric analyses indicate that the Arctic is a source of CH4 to the atmosphere of between 15 and 50 Tg CH4/yr, which is between 3% and 9% of the net land/ocean source of 552 Tg CH4 yr−1 (582 Tg CH4/yr source − 30 Tg CH4/yr soil sink) estimated by AR4 (Denman et al. 2007). In comparison with the top-down analyses, our synthesis of bottom-up analyses, which indicates that most of the source is from wetland ecosystems, has higher lower and upper uncertainty bounds (32 and 112 Tg CH4/yr, respectively) for the net source of CH4 from the surface to the atmosphere in the Arctic. The uncertainty bounds from the bottom-up analyses would be similar to that of the top-down analyses if the estimated 15–35 Tg CH4/yr from thermokarst lake systems of the Arctic by Walter et al. (2006) were not considered in our synthesis. An important research question is whether consideration of the fluxes estimated by Walter et al. (2006) would influence the top-down estimates of CH4 exchange for the Arctic.
From the global perspective, the transfer of C from land to ocean systems in the Arctic roughly reflects the 11% of global river discharge of water from land to ocean represented by the pan-arctic drainage basin. Our analyses indicate that approximately 80 Tg C/yr are transferred from land to ocean via rivers (Fig. 3), which is approximately 10% of the estimated 0.8 Pg C/yr transferred from land to ocean via rivers globally (Sarmiento and Gruber 2006). Coastal and wind erosion are responsible for the transfer of approximately another 8 Tg C/yr, with coastal erosion responsible for about 75% of the erosional transfer. We estimate that the annual transfer of C to sea floor sediments of the Arctic is approximately 11 Tg C/yr (Fig. 3), which is about 5% of the estimated 0.2 Pg C/yr transferred to ocean floor sediments throughout the globe (Sarmiento and Gruber 2006). This mirrors approximately the areal representation of the Arctic Ocean and its associated shelf seas in the global ocean system.
Sensitivities and Implications of Arctic Carbon Responses to Climate Change
General perspectives
The C cycle of the Arctic has the potential to influence the climate system through feedback pathways involving responses in terrestrial and marine systems of the region (Figs. 4 and 5). The feedback pathways in Figs. 4 and 5 have largely been discussed in McGuire et al. (2006). In this review, we are primarily concerned with clarifying key uncertainties and vulnerabilities of the climate system to responses that may occur on two time frames: (1) 10–20 years and (2) 50–100 years. First, we discuss the potential responses of CO2 and non-gas hydrate CH4 exchange of terrestrial ecosystems for these two time frames, followed by that for marine systems. We finish this section by discussing the release of CH4 from gas hydrates of both terrestrial and marine systems. Then, in How sensitive are carbon responses over the next 50 to 100 years?, we focus our review on research that has attempted to assess the sensitivity of terrestrial and marine C pools to potential changes in climate over the next 50 to 100 years.

Terrestrial carbon responses to warming in the Arctic that influence the climate system. Physical responses of snow cover and permafrost on the left are coupled with functional (physiological) and structural biotic responses on the right. Physiological feedbacks designated on the diagram are (1) increased decomposition of soil organic matter (increased CO2), (2) vegetation productivity (NPP) response to drought stress (increased CO2), (3) methanogenesis response to increasing temperature and soil moisture (increased CH4), (4) methanogenesis response to drying (decreased CH4), (5) NPP response to longer growing season (decreased CO2), (6) NPP response to increased N mineralization (decreased CO2), (7) NPP response to temperature increase (decreased CO2), and (8) NPP response to increased atmospheric CO2 concentration (decreased CO2). The structural feedbacks shown are (9) expanded distribution of tundra shrubs (decreased CO2), (10) treeline advance (decreased CO2), (11) forest degradation (increased CO2), (12) conversion of light to dark taiga (decreased CO2), and (13) increased occurrence of fire, insects, and logging (increased CO2). The physical responses include (14) the release of inorganic carbon from permafrost thaw (increased CO2, increased CH4). The figure is modified from McGuire et al. (2006).

Marine carbon responses to warming in the Arctic that influence the climate system. Responses of sea ice, glaciers, and sea bed permafrost (on the left) are coupled with biotic responses (on the right) through several mechanisms affecting carbon dynamics. The physical responses depicted on the diagram are (1) increased CO2 solubility in response to more open water and lower salinity (decreased CO2), (2) decreased CO2 solubility with increasing temperature (increased CO2), (3) the burial of organic C in deep ocean sediments (decreased CO2), and (4) the release of inorganic carbon from sediments, ocean floor, and submerged permafrost (increased CO2, increased CH4). The biotic feedbacks include (5) biotic productivity response to increased light and nutrients (decreased CO2), (6) stable photic zone (increased CO2) and (7) warming-induced increases in decomposition and methanogenesis (increased CO2, increased CH4). The figure is modified from McGuire et al. (2006).
Response of feedbacks pathways in terrestrial ecosystems of the Arctic
Processes in terrestrial regions of the Arctic that are sensitive to change on a 10–20 year time frame are those that are primarily sensitive to changes in atmospheric variables (e.g., temperature, precipitation, CO2 concentration), and include photosynthesis (feedback pathways 2, 5, 6, and 7 in Fig. 4) and fire (feedback pathway 8 of Fig. 4). The net direction of the photosynthesis and fire feedbacks depends substantially on landscape wetness and dryness. For example, dry conditions may decrease photosynthesis more so than it is promoted by longer growing seasons, and may also result in the release of C by triggering an increase in fire activity across boreal forest regions. The analysis of Thompson et al. (2006) indicates that the trends in C storage in Alaskan tundra from 1981–2000 were positive under colder and wetter conditions and negative under drier or warmer conditions. The studies by Balshi et al. (2009a, b) suggest that climate warming in boreal North America is likely to promote higher fire frequency, resulting in the release of C to the atmosphere from terrestrial ecosystems of the Arctic. However, whether the land acts as source or sink of C to the atmosphere depends on whether photosynthesis in undisturbed boreal forests responds to increases in atmospheric CO2 (Balshi et al. 2009b). The uncertainty about the response of vegetation photosynthesis to increases in atmospheric CO2 is the largest single factor contributing to the uncertainty in process-based model analyses of how C storage in Arctic ecosystems will respond to global change. Another large source of uncertainty stems from unknown potential responses of disturbance regimes (e.g., insects, forest harvest, and forest degradation; feedback pathways 11 and 13 in Fig. 4) to changes in climate. Evidence suggests possible increases in the frequency of fires (Kasischke and Turetsky 2006, Soja et al. 2007) and insect outbreaks (Kurz et al. 2008), which could create a large source of CO2 to the atmosphere from boreal forest regions.
The 50–100-year time frame involves processes that respond more slowly to climate than the short-term processes described above. For terrestrial ecosystems, these include slow ecological processes and responses associated with the thawing of permafrost. Ecological processes that might respond slowly to warming include an increase in shrub tundra, changes in tree species, treeline advance, and forest degradation (feedback pathways 9 and 10 in Fig. 4). The expansion of shrubs is best documented for the North Slope of Alaska, where shrub cover has increased by about 16% in land area since 1950 (Tape et al. 2006), and shrub growth appears to be increasing throughout the tundra of much of the Arctic (Kaplan et al. 2003). While treeline advances into tundra ecosystems have been documented during recent decades in Russia, Canada, and Alaska (McGuire et al. 2007), the rate of advance is very slow and most likely to affect landscape C storage on the order of 500–1000 years (Starfield and Chapin 1996, Chapin and Starfield 1997, Lloyd et al. 2002).
Changes in the distribution of tree species within the boreal forest are also possible in the next 50–100 years, with boreal broadleaf deciduous species likely to become more widely distributed if disturbance frequency increases (Chapin et al. 2000). While a number of dynamic global vegetation models indicate that temperate species are likely to move northward in response to a warming climate during the next 50–100 years (Cramer et al. 2001), these models generally do not include processes that would be responsible for migration of temperate species into boreal regions. Similar to the northward expansion of treeline, the latitudinal migration of temperate forest species into the southern boreal forest may be a dynamic operating at longer time scales (i.e., 500–1000 years). This process has been found to occur on shorter time scales along elevational gradients, however, and may be facilitated by more frequent or severe disturbance (Beckage et al. 2008). Regardless of the rate at which migration occurs, these changes in species distribution are expected to decrease C storage as boreal broadleaf deciduous and temperate forest ecosystems generally have smaller ecosystem C stocks than the boreal conifer forest ecosystems that they would replace (e.g., see Smith and Shugart 1993).
There is a great deal of uncertainty on the future rate of permafrost degradation in response to climate warming. One argument is that thaw is likely to proceed at a slow pace during the next century because the thermal regime of permafrost is buffered by the overlying, protective layer of organic matter (Yi et al. 2007). The simulations of Lawrence and Slater (2005), which did not take into consideration the protective layer of organic matter, indicate that substantial permafrost thaw could happen in the first half of the 21st century. However, when the protective layer of organic matter is taken into consideration, the degradation of permafrost is somewhat slower with most of the loss occurring by around 2070 (Lawrence et al. 2008). The simulations of Euskirchen et al. (2006), which also considered the protective layer of organic matter, estimated that permafrost loss in the first 40–50 years of the 21st century would be minimal, and primarily located in regions characterized by a discontinuous permafrost regime at the transition zone between boreal and temperate forest ecosystems (Fig. 6). Although Euskirchen et al. (2006), Lawrence and Slater (2008), and Lawrence and Slater (2005) disagree on the temporal pattern, the analyses each estimate substantial loss of near surface permafrost by 2100 (between 6 and 11 × 106 km2 among the analyses). Thus, while these analyses identify the potential for the mobilization of C stocks associated with permafrost thaw during this century, it is not clear at what time scale this dynamic will operate. Furthermore, none of these studies considered the potential effects of fire, which is a disturbance agent that has the potential for the rapid release large stocks of C to the atmosphere. This release can occur not only in the direct and immediate combustion of organic matter, but also by exposing the remaining C stocks in the soil to substantial warming and decomposition through removal of the protective organic layer above the permafrost.

The mean extent of permafrost estimated for the time periods (a) 1990–2000, (b) 2040–2050, and (d) 2090–2100 based on simulations of Euskirchen et al. (2006). The pink area in panels (c) and (e) indicates the loss of permafrost between panels (a) and (b) and between panels (a) and (d), respectively.
Once permafrost thaws, the direction of feedbacks to the climate system depends largely on landscape wetness and dryness. An increase in landscape wetness will tend to promote increased CH4 emissions through enhanced methanogenesis (feedback 3 in Fig. 4) while slowing CO2 release because of anaerobic conditions that hinder decomposition. In contrast, an increase in landscape dryness can promote greater release of CO2 through enhanced decomposition (feedback 1 in Fig. 4). A number of analyses are indicating that landscape dryness is increasing over the last several decades in the boreal forest, particularly in areas of discontinuous permafrost (Smith et al. 2005, Riordan et al. 2006, Bunn et al. 2007, Goetz et al. 2007). Large releases of CO2 are possible if landscape drying were to become pervasive in areas of continuous permafrost as ponds and wetlands comprise a substantial part of the landscape (Smol and Douglas 2007).
Response of feedbacks pathways in marine ecosystems of the Arctic
For marine systems, processes sensitive to changes in surface conditions, such as sea ice cover and near surface water temperature, could have substantial responses to climate change on the 10–20 year time frame. Similarly, changes in river discharge and exchanges with surrounding oceans have a direct, near-term impact on the marine ecosystem through its effect on CO2 fixation. The loss of sea ice will support an increasing air–sea flux of CO2 that is otherwise impeded by the ice cover, along with triggering an increase in the input of light and atmospheric mixing energy to the marine system. On the other hand, the melting of sea ice will also add freshwater to the system, which will lower salinity and tend to stabilize the surface layer. As such, a decline in sea ice cover as a result of rising temperature can have both positive and negative feedbacks with respect to the C cycle of the Arctic: ocean CO2 sequestration can be increased by amplifying the physical transfer of DIC to the surface layer (feedback 1 in Fig. 5) and biological uptake of CO2 through added light and nutrient availability (feedback 5 in Fig. 5), while CO2 uptake can decrease through changes in surface layer chemistry that lead to the creation of a stable photic zone (feedback 6 in Fig. 5). The balance of these competing feedbacks and their overall effect on the uptake of CO2 into the marine system is not clearly understood, as the seasonal timing of these processes is crucial to the net result. Also, ocean acidification associated with increases in atmospheric CO2 may modify these feedbacks by affecting inorganic and biotic C dynamics in the ocean (Guinotte and Fabry 2008).
The key process for enhancing nutrient availability in the Arctic Ocean is an increase in nutrient input from the surrounding seas. This process will have a direct impact on primary production and the draw down of CO2 from the atmosphere. The uptake of CO2 by marine systems is also driven by decreases in both water temperature and salinity. With a lack of sea ice in the summer, increased water temperatures would decrease the equilibrium concentration of DIC because of decreased CO2 solubility (feedback 2 in Fig. 5). While a lower salinity with a decrease in sea ice will tend to counteract this effect (feedback 1 in Fig. 5), the effect of increasing temperature on decreasing solubility is likely to be stronger. Additionally, an increase in water temperature has the potential to promote the release of CO2 and CH4 through enhanced decomposition and methanogenesis of organic C in the water column (feedback 7 in Fig. 5).
The discharge of freshwater from the terrestrial surface to the marine system has increased in the pan-arctic drainage basin during the 20th century (Peterson et al. 2002), and the projected increase in precipitation in the Arctic suggests that this trend will continue or accelerate through the 21st century. It is generally thought that C delivery to the ocean will be correlated to discharge, although it is not clear whether the distribution of C as DIC, PIC, DOC, and POC will change (Striegl et al. 2007). In drainage systems dominated by discontinuous permafrost, it is expected that ground water flow will increase along with in-stream processing of DOC, resulting in greater riverine CO2 efflux as well as DIC delivery to the ocean (Striegl et al. 2007). Responses of riverine biogeochemistry to warming will occur as a result of changes in organic composition, chemical/phase speciation, and C yields from rivers, and these changes will manifest differently in the particulate and dissolved components undergoing transport (Guo et al. 2007). Changes in permafrost dynamics, hydrological cycles, vegetation, and microbial processes have the potential to play an important role in responses of riverine C dynamics. If the delivery of organic C from land to ocean increases in response to a warming Arctic climate, then there is the potential to increase C sequestration through burial in coastal sediments (feedback 3 in Fig. 5). However, increased delivery of organic C to the ocean is likely to lead to potential C release through enhanced decomposition and methanogenesis in the water column (feedback 7 in Fig. 5).
Release of CH4 from hydrates in terrestrial and marine regions of the Arctic
The release of free inorganic CO2 and CH4 frozen in terrestrial soils and marine sediments, in addition to the dissolution of CH4 from gas hydrates (feedback pathways 14 in Fig. 4 and 4 in Fig. 5) as a result of permafrost thaw, are expected to proceed at a very slow pace. While there is uncertainty about the degree to which near surface permafrost will thaw, the thawing at greater depths due to the transfer of heat from the overlying atmosphere is likely to be a millennial-scale response. This disappearance of thick permafrost is most likely to occur in settings where the ice content is high and its vertical structure is exposed to the atmosphere and erosional runoff (e.g., along river banks).
We have estimated that between 5 and 195 Pg CH4 exists as gas hydrate within and below subterranean and submerged permafrost of the Arctic. A doubling of atmospheric CH4 concentration would require the release of an additional 50 Pg CH4 from all sources over the next 100 years (Archer 2007). Thus, it is conceivable that substantial release of CH4 from the melting of gas hydrate could influence the radiative forcing of climate. The northern coast of Siberia has been eroding for thousands of years and it is thought that this erosion has exposed hydrates to melting (Romankevich 1984). However, the erosion mechanism is not sufficient to support the release of a large amount of CH4 from the melting of gas hydrate, which would require increased melting at depth (Corell et al. 2008). The mechanism for this enhanced release has not been elucidated and it is unlikely that CH4 would reach the atmosphere through 0.2–1.2 km thick sections of sediment without significant oxidation (Corell et al. 2008).
How sensitive are carbon responses over the next 50 to 100 years?
Projections of C dynamics in the Arctic over the next 50 to 100 years have primarily been conducted through two types of modeling exercises: in uncoupled/partially coupled studies, and in fully coupled studies. The study of Zhuang et al. (2006), which focused on terrestrial responses of CO2 and CH4 north of 50° N from 1991 to 2100, is exemplary of the partially coupled studies. The study was driven by (1) atmospheric CO2 and climate projected by MIT's Integrated Global Systems Model (IGSM) for high, intermediate, and low scenarios of future anthropogenic emissions and (2) fire scenarios that assumed increases in annual area burned of 50%, 100%, and 150%. Similar to the studies of Balshi et al. (2007, 2009b), Zhuang et al. (2006) found that the change in C storage during the 21st century was highly dependent on assumptions about CO2 fertilization, with increases in C storage of up to 24 Pg C in simulations with CO2 fertilization and losses in C storage of up to nearly 50 Pg C in simulations with no CO2 fertilization. The loss of 50 Pg C is approximately 1000 g C/m2 and is about 7% of the current C content of CO2 in the atmosphere. Zhuang et al. (2006) also projected that net CH4 emissions would increase in all scenarios, with a doubling of CH4 emissions under the scenarios for high fossil fuel emissions.
While such projections include substantial changes in C storage and in CH4 exchange with the atmosphere, adding them back into the IGSM simulations has very little effect on atmospheric CO2 and CH4 concentrations in comparison with the effects of increases in anthropogenic emissions of CO2 and CH4. For example, a change of 50 Pg C in terrestrial C storage is small in comparison with 1500 Pg C emissions from the burning of fossil fuel during the 21st century in the low emissions scenario. The maximum effects would be to decrease climate forcing by 0.065 W/m2 among simulations that included CO2 fertilization, and to increase forcing by 0.073 W/m2 among the simulations that assumed no CO2 fertilization. Thus, the study of Zhuang et al. (2006) indicates that responses of C storage and changes in CH4 emissions in the Arctic have to be comparable to increases in CO2 and CH4 emissions from fossil fuel burning in order to have a notable effect on the climate system.
During the last decade several comprehensive global-scale coupled carbon cycle climate models have been developed, and the first simulations over the time period between 1850 and 2100 have been performed. While the pioneering study of Cox et al. (2000) has shown a very strong positive carbon-climate feedback, subsequently published coupled model simulations tend to exhibit somewhat smaller positive feedbacks to the climate system. The results of a more recent coupled carbon cycle climate model intercomparison project (C4MIP) have been described by Friedlingstein et al. (2006), which indicate that carbon–climate feedbacks would tend to increase atmospheric CO2 by 20 to 200 ppm by volume by 2100, levels that translate into additional climate warming of between 0.1° and 1.5°C. In general, the models in C4MIP simulate that high latitudes will store more C in response to projected climate change, with the increase in atmospheric CO2 associated with carbon–climate feedbacks primarily caused by the decreased uptake of CO2 in the tropics.
It is important to recognize that the fully coupled models incorporate only a subset of processes that may influence carbon–climate feedbacks of terrestrial ecosystems in the Arctic. The coupled models are capable of considering (1) how the lengthening of snow-free period may lead to increased CO2 uptake; (2) how warming of near surface atmosphere and soils may lead to higher decomposition rates; and (3) how warming and changes in vertical water exchange with the atmosphere may affect distribution of broadscale vegetation types via competition for light and water. Several recent studies have identified the importance of organic soils and permafrost dynamics on the seasonal dynamics of CO2 (Zhuang et al. 2003, Euskirchen et al. 2006), the decomposition of deep organic soil C (Zhuang et al. 2006), the importance of responses of plant functional types in the Arctic that are not generally considered by dynamic global vegetation models (Chapin et al. 2005a), and the explicit treatment of disturbance and land use effects (e.g., Kurz et al. 2008, Balshi et al. 2009b). Thus, the consideration of these effects is generally inadequate or incomplete because of other important processes in northern high latitude terrestrial ecosystems that have yet to be considered in coupled carbon–climate models.
Overall, coupled carbon–climate models do not consider several issues that are important in the dynamics of terrestrial ecosystems in the Arctic: (1) how mosses and organic soils influence soil thermal and hydrologic dynamics; (2) how hydrologic responses influence the extent of wetlands and the position of water table within wetlands to influence C dynamics of wetland ecosystems; (3) how interactions among plant functional types of ecosystems in the Arctic influence C storage; and (4) how interactions between C and nitrogen (N) dynamics influence C storage. Similarly, coupled carbon–climate models do not consider several issues that may be important to the responses of C cycle in marine systems of the Arctic: (1) the effects of sea ice changes on the solubility and biological pumps for CO2 uptake, (2) the dynamic coupling of terrestrial and marine C, and (3) the response of seabed permafrost and its effects on C stored in seabed permafrost.
Some progress is now being made to incorporate a consideration of organic soils in climate models (Letts et al. 2000, Beringer et al. 2001, Yi et al. 2006, 2007, Lawrence and Slater 2008), but there is still the need to have these dynamics considered in fully coupled carbon–climate models. These dynamics are particularly important in properly representing the effects of soil temperature and moisture on decomposition of organic soil (Zhuang et al. 2001, 2002, 2003, 2006) and to representing how wildfire will affect the release of C from organic soils (Kasischke and Turetsky 2006).
The ability to predict seasonal, interannual, and longer-term variability in the extent of inundation and of the position of the water table within wetlands is an important challenge because methanogenesis occurs primarily under anoxic conditions. Several studies suggest that wetland extent may currently be changing in much of the Arctic (Klein et al. 2005, Smith et al. 2005, Riordan et al. 2006), and it is important for coupled carbon-climate models to represent changes in wetland extent and water table position. Coupled carbon–climate models are just beginning to consider how hydrologic responses influence wetland extent and CH4 emissions using the TOPMODEL approach (Gedney et al. 2004), but these models have not been well tested for their dynamics in northern high latitude terrestrial regions. Interactions between permafrost and surface hydrology are emerging as important processes in CH4 exchange of terrestrial ecosystems in the Arctic (Walter et al. 2006, 2007). A major challenge for the science community is to better understand how responses of permafrost dynamics will influence the extent of wetlands, and the dynamics of water table position within wetlands, in a fashion that can be represented in global coupled carbon–climate models (Corell et al. 2008).
While some coupled carbon–climate models represent how changes in climate influence the distribution of vegetation types in the Arctic, the categories considered by these models do not include all of the plant functional types that are thought to be important in the carbon–climate feedbacks of northern high latitude terrestrial ecosystems. Key plant functional types that have not been considered include (1) mosses, (2) lichens, and (3) deciduous shrubs. As noted earlier, mosses play an important role in affecting the soil thermal and hydrologic dynamics (Beringer et al. 2001, Zhuang et al. 2001), and the accumulation of incompletely decomposed moss is a major component of C storage in soils of northern high-latitude terrestrial regions (Gorham 1991). While lichens do not represent a major pool of stored C, they are ubiquitous across the Arctic and play an important role in local energy feedbacks to the climate system (Chapin et al. 2005a, McGuire et al. 2006). The distribution of deciduous shrubs has been changing in the Arctic (McGuire et al. 2007), and these dynamics have consequences for energy exchange (Chapin et al. 2005a, Euskirchen et al. 2009). Thus, an important challenge is to incorporate the dynamics of mosses, lichens, and shrubs in global coupled carbon–climate models as the responses of these plant functional types have important physical and biogeochemical implications for the climate system.
The C uptake of northern terrestrial ecosystems has long been known to be limited by N availability in the soil (Chapin et al. 1986, Vitousek and Howarth 1991). A major issue related to the response of C uptake in these ecosystems to climate change has been whether the release of N from decomposition would lead to a greater uptake of N by plants and cause greater uptake and storage of C in vegetation (McGuire et al. 1992, Shaver et al. 1992). This response primarily depends on whether N losses exceed N inputs (Rastetter et al. 1991). This issue has only recently been considered in coupled carbon–climate models (Thornton et al. 2007, Sokolov et al. 2008), but it is clear from these analyses that the responses of the C cycle in the absence of N feedbacks is very different from the C cycle that considers N feedbacks.
With respect to the representation of C dynamics in marine systems, coupled carbon–climate models have not adequately considered how changes in sea ice will affect the solubility and biological pumps for CO2 uptake. Also, the dynamic delivery of C from terrestrial to marine systems in the Arctic is not adequately considered. At best, the inputs to ocean C cycle models are prescribed and there is the need to develop the capability to consider the dynamics of riverine and erosional C input to marine systems. Furthermore, modeling the fate of C in marine systems is a challenge as sea ice coverage changes. How seabed permafrost dynamics influence the release of C are not considered in coupled carbon–climate models. While it is generally thought that the thawing of seabed permafrost is likely to affect the global C cycle on millennial scales, it could affect the climate system on shorter time scales if it leads to a substantial release of CH4 from hydrates. It remains a major challenge for the scientific community to represent how climate change will influence the release of CH4 from hydrates in both terrestrial and marine systems of the Arctic (Corell et al. 2008).
Recommendations for Future Research
Analyses to date indicate that the sensitivity of the C cycle of the Arctic during the remainder of the 21st century is highly uncertain. Applications of regional terrestrial ecosystem models suggest that there is potential for CH4 emissions to increase dramatically in response to warming and that there is the potential for substantial release of CO2 to the atmosphere from increased wildfire activity and the decomposition of soil organic matter. However, analyses indicate that a net release of CO2 to the atmosphere is most likely to occur if the uptake of C by terrestrial vegetation is not enhanced by increases in atmospheric CO2. There have not been applications of regional marine ecosystem models that allow us to identify the degree of uncertainty in responses of the marine C cycle of the Arctic. Because there has been limited progress in regional modeling efforts about how the C cycle of the Arctic will respond to climate change, it is not surprising that coupled carbon–climate models do not represent processes that are thought to be important in the C cycle of the Arctic. The limited progress in regional modeling efforts can be improved through integrated regional studies that (1) link observations of C dynamics to the processes that are likely to influence those dynamics, and (2) incorporate the understanding gained from these integrated studies into both uncoupled and fully coupled carbon-climate modeling efforts. We need integrated studies of carbon dynamics in the Arctic that link observations with processes reponsible for dynamics and incorporate the understanding gained into uncoupled and fully coupled carbon–climate modeling efforts. Integrated studies of the Arctic should be focused on sensitive aspects of the carbon cycle of the Arctic and be designed to address the challengers of scaling through consideration of the full range of processes affecting carbon dynamics, developing observation networks that address spatial scaling issues, developing long-term observation networks that address temporal scaling issues, and facilitating research that focuses on representing processes that operate at fine scales into models that are used as tools to address questions at coarse scales.
Integrated studies of regional C dynamics should be designed to focus on sensitive parts of the system, i.e., parts of the system in which C responses could lead to substantial positive feedbacks to the climate system (or substantial modification of negative feedbacks; Figs. 4 and 5). Sensitive parts of the system in the terrestrial regions of the Arctic include regions that could experience increased decomposition, increased CH4 emissions, increased dryness of the landscape, and increased disturbance frequency and severity. These effects are most likely to occur in areas where permafrost is already close to thawing, areas that experience substantial changes in the extent of wetlands in response to permafrost thaw or drought, and areas that experience a substantial increase in fire frequency and severity. Sensitive parts of the system in marine regions of the Arctic include areas where there could be substantial release of both CO2 and CH4 (e.g., continental margins that could experience thawing seabed permafrost or from increased decomposition and methanogenesis). Also, it is important to understand how CO2 uptake in regions of sea ice retreat will be affected by processes that tend to enhance CO2 uptake vs. those that tend to reduce CO2 uptake.
“Scaling” is the key challenge to designing integrated studies that link observations and processes of C dynamics, which are often conducted at fine spatial and temporal scales, in a way that the understanding can be transferred to models that operate at coarse spatial and/or temporal scales. Scaling requires both the representation of fine-scale processes at a coarser scale and the representation of interactions of processes that operate across a spectrum of scales. To address the challenge of scaling, integrated studies of sensitive parts of the C cycle of the Arctic should be designed so that they: (1) conduct research that focuses on understanding the mechanistic controls over processes that operate at different spatial and temporal scales; (2) develop observation networks designed for addressing the challenges of scaling in space; (3) develop long-term observations networks designed for addressing the challenges of scaling in time; and (4) facilitate research that focuses on representing processes that operate at fine scales into models that are used as tools to address questions at coarse scales.
Integrated studies should consider the full range of processes that may influence C cycling. For example, it may be important to understand how regional CO2 and CH4 exchange are influenced by key processes such as (1) the uptake of CO2 through photosynthesis and the release of CO2 through decomposition, which are generally affected by fine-scale variability in soil temperature and moisture, (2) wetland contraction associated with both increased evapotranspiration rates and drainage through thawed permafrost, and (3) the combustion of C in a region that is experiencing an increase in the frequency and severity of fires. A key to better representing these processes in regional and global models is the development of hierarchical observation networks (including both fine- and coarse-scale observations) that provide the capability for representing the processes that operate across various spatial and temporal scales. For example, tall tower technology now provides the means to measure CO2 and CH4 exchange over scales of hundreds of square kilometers, while short tower and chamber technology can provide information on the processes responsible for exchange at much finer spatial scales. The integration of information from these different scales allows the testing of scaling approaches. This includes regional analyses of satellite-based algorithms of C cycling, the development of which requires information from ground-based networks. Coarse-scale measurements can also be useful in identifying when substantial changes are occurring in a region. For example, monitoring 14C and CH4 of rivers can provide an index of permafrost stability. Such coarse-scale measurements need to be coupled with systematic measurements of drivers of C cycle processes (e.g., soil temperature and moisture measurements).
Observation networks also should be designed so that they represent the operation of processes that occur at different temporal scales. In the Arctic, observations on winter and shoulder season processes are often lacking in measurement networks. For example, monitoring efforts in rivers often miss the C load of rivers during the peak spring runoff, which results in a systematic underestimate of C delivered to the ocean through rivers. Also, more atmospheric measurements of CH4 are needed to better understand the seasonality and magnitude of CH4 emissions in the Arctic. In general, time series of C cycle observations in both the terrestrial and marine parts of the Arctic need to be improved to better understand the various temporal scales of variability (inter-annual to decadal to multi-decadal) in the observations and processes responsible for that variability. In particular, the use of autonomous instruments to make observations may improve both temporal and spatial coverage in the Arctic.
The final step to an integrated approach to better understand the sensitivity of the C cycle of the Arctic is research that focuses on incorporating the understanding gained from observational and process studies across a spectrum of spatial and temporal scales into both uncoupled and fully coupled carbon-climate models. The incorporation of this information requires the implementation and testing of scaling approaches, which is generally most efficiently accomplished with uncoupled models. Such comparisons between scaling approaches and the information from large-scale and long-term hierarchical observational and process-study networks may yield new insights into the scales at which processes operate and identify new processes that need to be considered at particular scales. Once this insight is achieved in regional applications of uncoupled models, it can be more efficiently incorporated into fully couple carbon-climate models of the earth system, which can more confidently explore the consequences of how responses of the C cycle of the Arctic may influence the climate system.
Acknowledgments
The assessment that led to the development of this review was sponsored by the Arctic Monitoring and Assessment Program (AMAP), the Climate in the Cryosphere (CliC) Program, and the International Arctic Science Committee (IASC). We thank (1) all of the numerous scientists who participated in the community review of the assessment, (2) the two anonymous reviewers of this publication, (3) Eugenie Euskirchen, who helped in preparation of some of the figures, and (4) Joy Clein, who helped with final preparation of the accepted manuscript. Funding to support community review of the assessment document was provided by the National Oceanic and Atmospheric Administration (NOAA) through the University Corporation for Atmosphere Research (UCAR); the National Science Foundation (NSF) through the International Arctic Research Center (IARC); the U.S. Geological Survey; the AMAP Heads of Delegations from Denmark, Finland, Norway, and Sweden; IASC; and the World Climate Research Programme (WCRP). The activities of the writing committee were supported, in part, by the NSF Arctic System Science Program as part of the Arctic Carbon Cycle Synthesis Project (OPP-0531047).